
- Remove the current class from the content27_link item as Webflows native current state will automatically be applied.
- To add interactions which automatically expand and collapse sections in the table of contents select the content27_h-trigger element, add an element trigger and select Mouse click (tap)
- For the 1st click select the custom animation Content 27 table of contents [Expand] and for the 2nd click select the custom animation Content 27 table of contents [Collapse].
- In the Trigger Settings, deselect all checkboxes other than Desktop and above. This disables the interaction on tablet and below to prevent bugs when scrolling.
It happened the way most humiliating injuries do: I was showing off.
My three-year-old son was on the swings at the playground. I decided to demonstrate proper technique — big arc, lean back, feet up — and somewhere mid-demonstration, I slipped. My head hit a metal bar on the way down. I lay on the ground looking up at the sky that seemed to be wobbling before me and thought: that’s going to be a problem.
It was a Monday evening, March 30th. My husband was out of town. It was just me and my toddler, and I needed to hold it together long enough to get us both home. By 7:30 PM I was in the emergency department. CT scan by 9:30. Out by 11 with the standard discharge instructions: rest, no screens, no strenuous activity, follow up if symptoms worsen.
What happened over the next week is not a story most concussion patients get to tell — because most concussion patients don’t have access to what I had access to. I am a VP of Marketing at Neurable, a neurotechnology company that embeds EEG sensors into consumer headphones to measure brain health in real time. Our platform generates something called a Brain Age score — a composite metric derived from a number of neurological signals. The platform also shares six cognitive dimensions: wakefulness, calmness, focused attention, cognitive speed, physical stress, and anxiety resilience. My baseline brain age, on a typical day, hovers around 31. I’m 41 chronologically. I’ve always found that gap quietly satisfying.
The afternoon after I hit my head my brain age was 53.1.
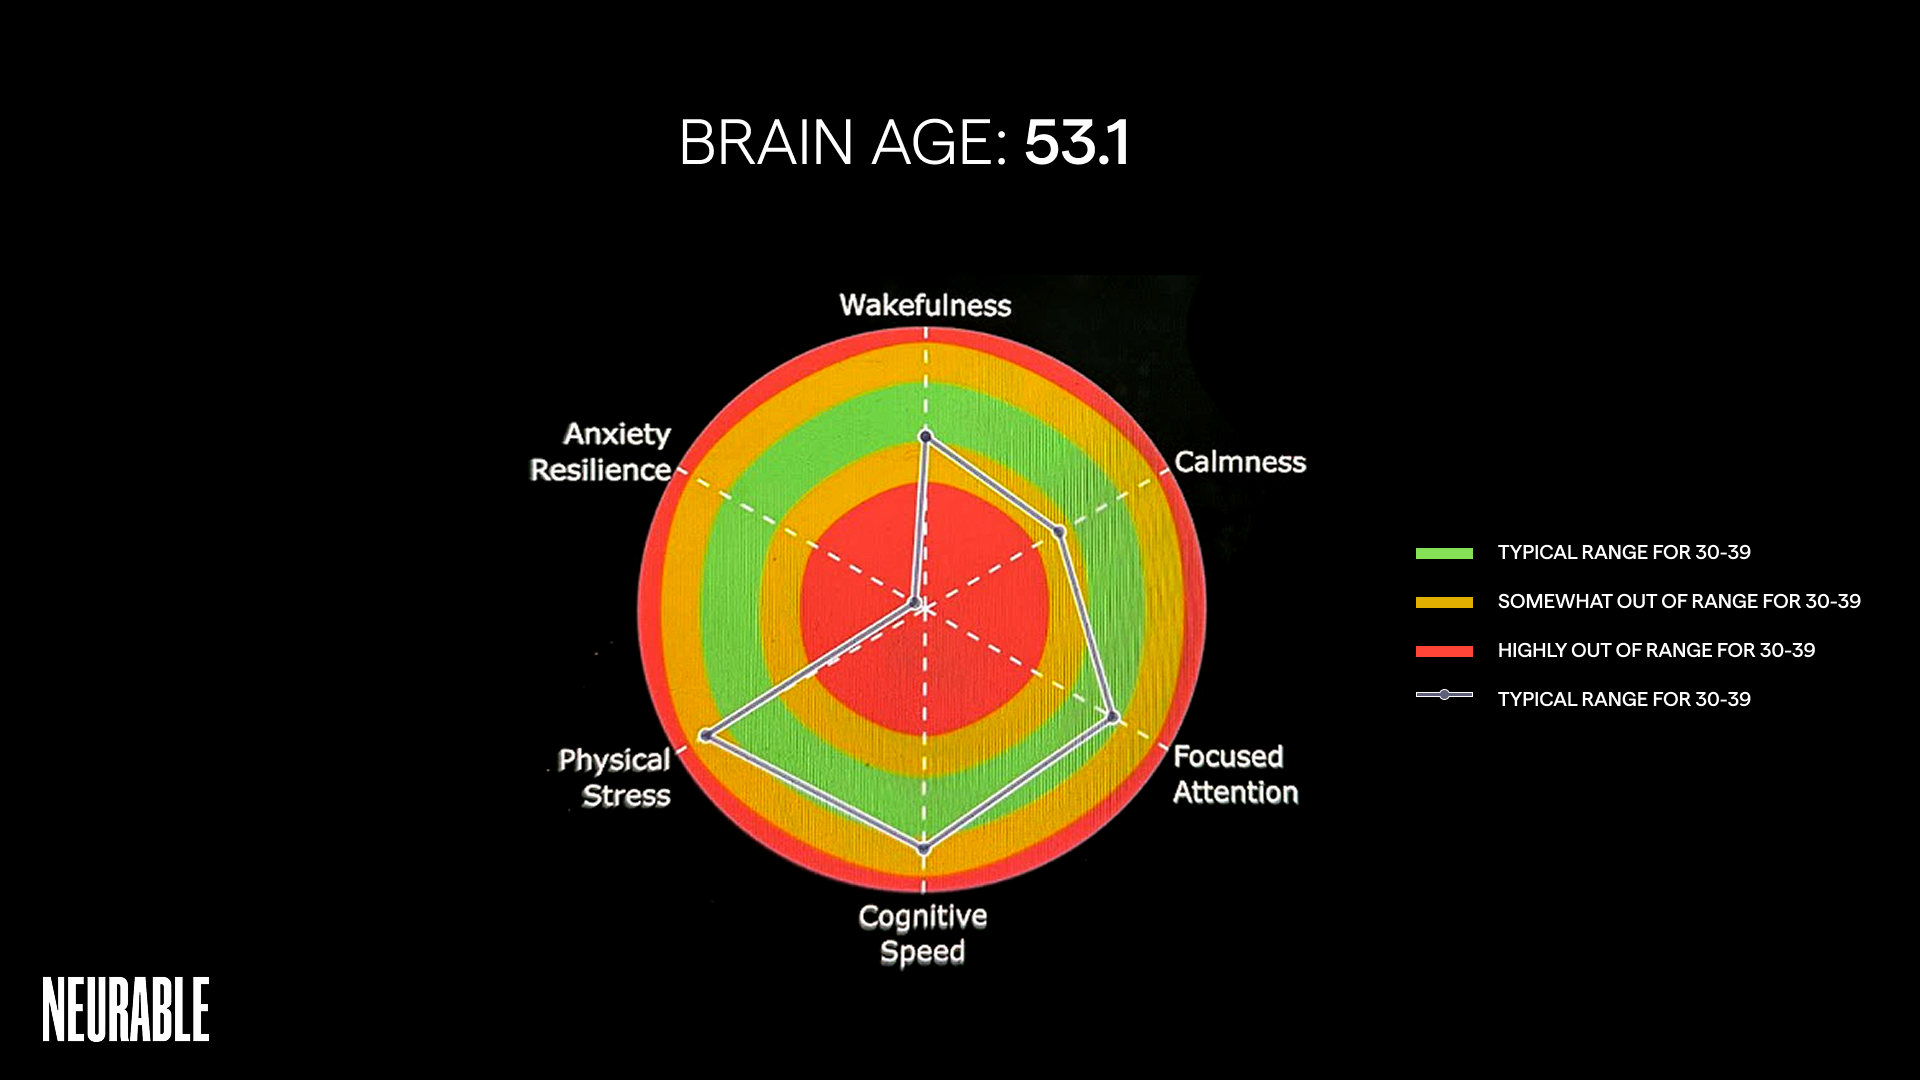
I managed to open the app despite the fact that screens were genuinely painful — the light felt like something physical, like pressure behind my eyes. The reading that came back stopped me.
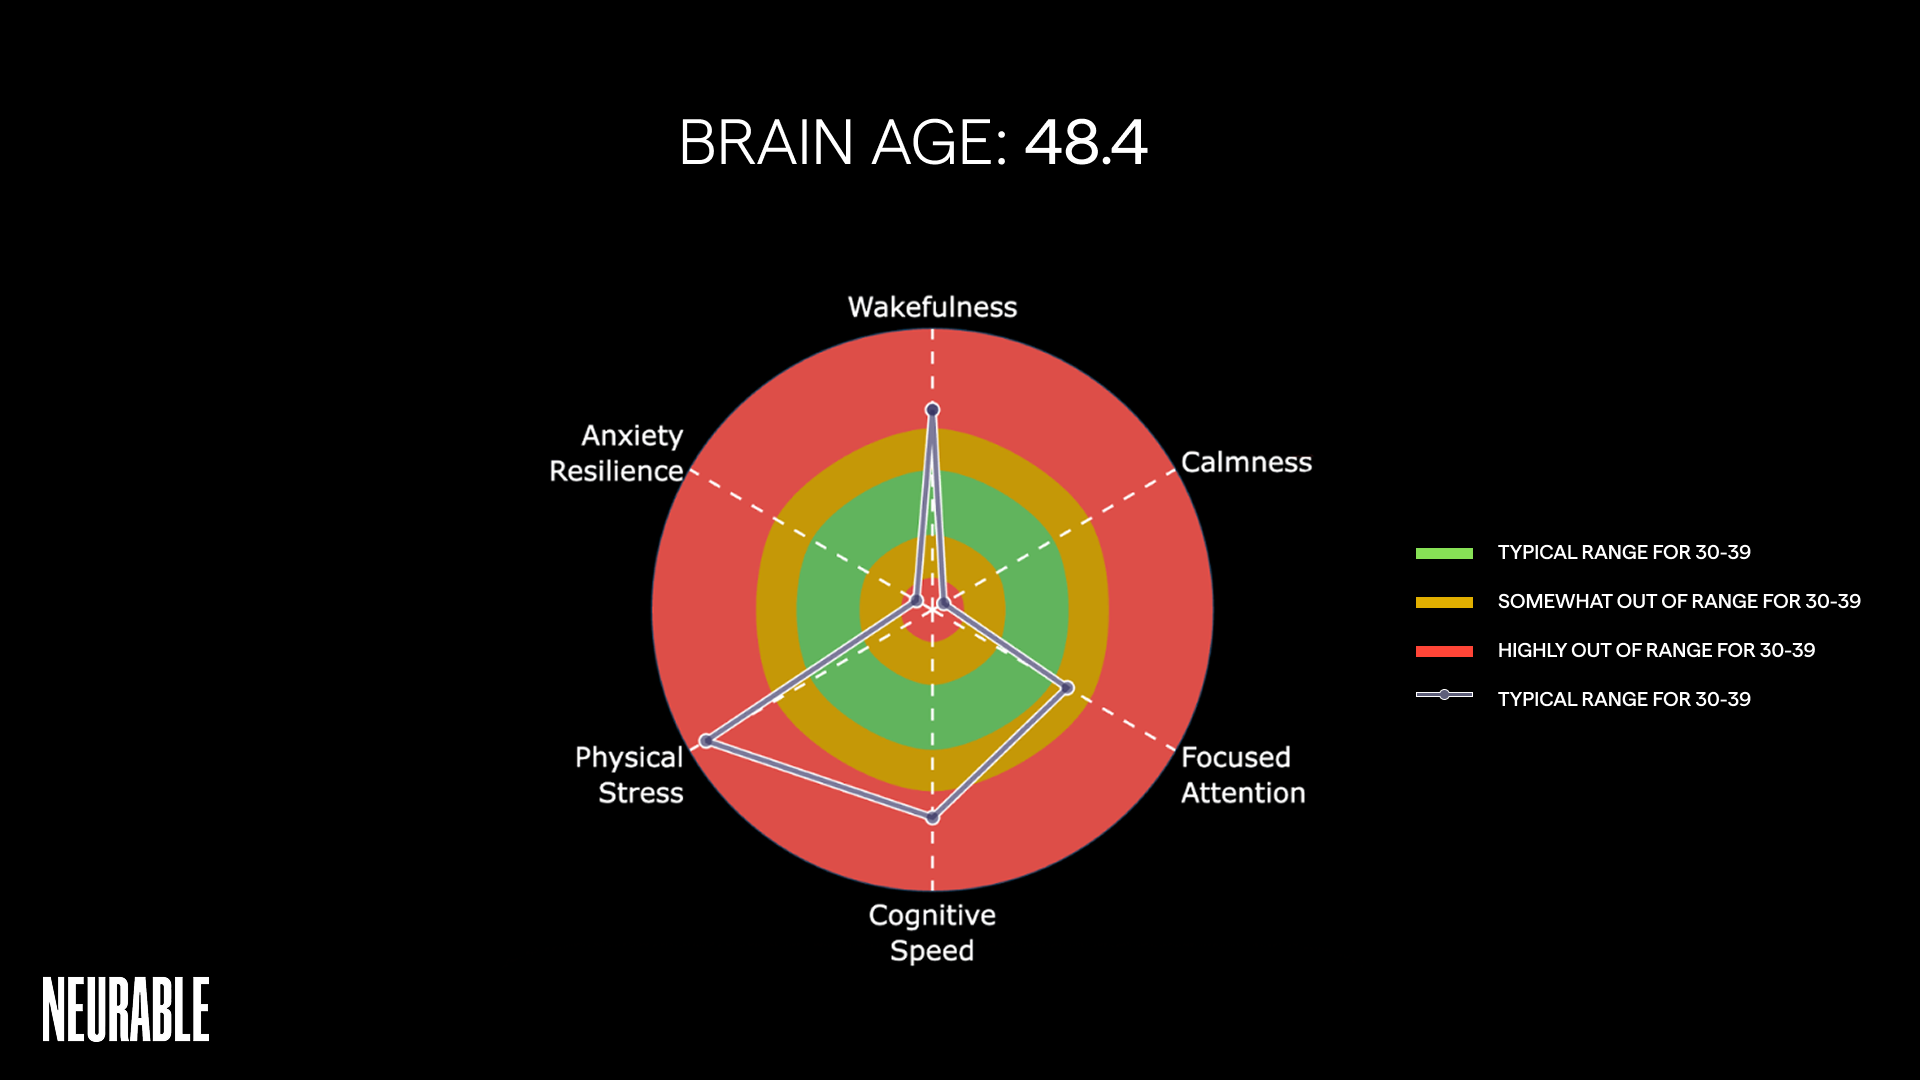
Over the following day, as I began to stabilize, something shifted in the chart’s shape. The overall scores improved slightly, but the symmetry broke. One axis stayed stubbornly worse than the others: anxiety resilience, pulled hard to one side while other metrics began their slow recovery.
A radar chart mapped my scores against the typical range for someone 30 to 39, where I normally sit comfortably. Every single axis was pushed deep into the red. Wakefulness, spiked — not depleted, but hyperactivated. Calmness, collapsed. Cognitive speed, pushed into overdrive. What I was looking at wasn't a brain shutting down. It was a brain in overdrive, overprocessing, fighting to stay on top of a situation that required it to: a moderate head injury, a toddler to get home safely, a husband out of town. The shape of the chart was almost perfectly round — a uniform bloom of red in every direction — which is its own kind of information. The acute phase looked like a whole-brain stress response. My brain, rendered in data, looked like a different person's brain. Twenty-two years older than the one I woke up with on Monday.
I flagged it to Dr. Alicia (Ally) Howell-Munson, Neurable’s research scientist. Their response stopped me.
“That asymmetry in anxiety resilience is consistent with a lateralized impact,” they told me. “We can see, in the pattern of the scores, which side of the head was affected. The brain doesn’t respond symmetrically to a one-sided injury — and that shows up in the data.”
I had hit the right side of my head. The data knew that. My CT scan — normal, clean, unremarkable — did not capture it.
This is the gap that most concussion patients fall into: the injury is real, the symptoms are real, but the standard diagnostic tools often show nothing. CT scans are designed to rule out bleeds and fractures. They are not designed to show you how your brain is functioning. Neuropsychological testing can get closer, but it’s typically administered days or weeks post-injury in a clinical setting, and it gives you a snapshot, not a film.
What I had was a film.
Over the following days I watched my brain age oscillate — worse in the mornings, slightly better by afternoon, then back up again. By the morning of April 3rd, four days after the fall, I dipped to 28.2 — a few points below my baseline of 31, a difference Ally noted was within the normal range of variation rather than a meaningful signal. The recovery wasn't dramatic. It was just quiet, incremental, and visible.
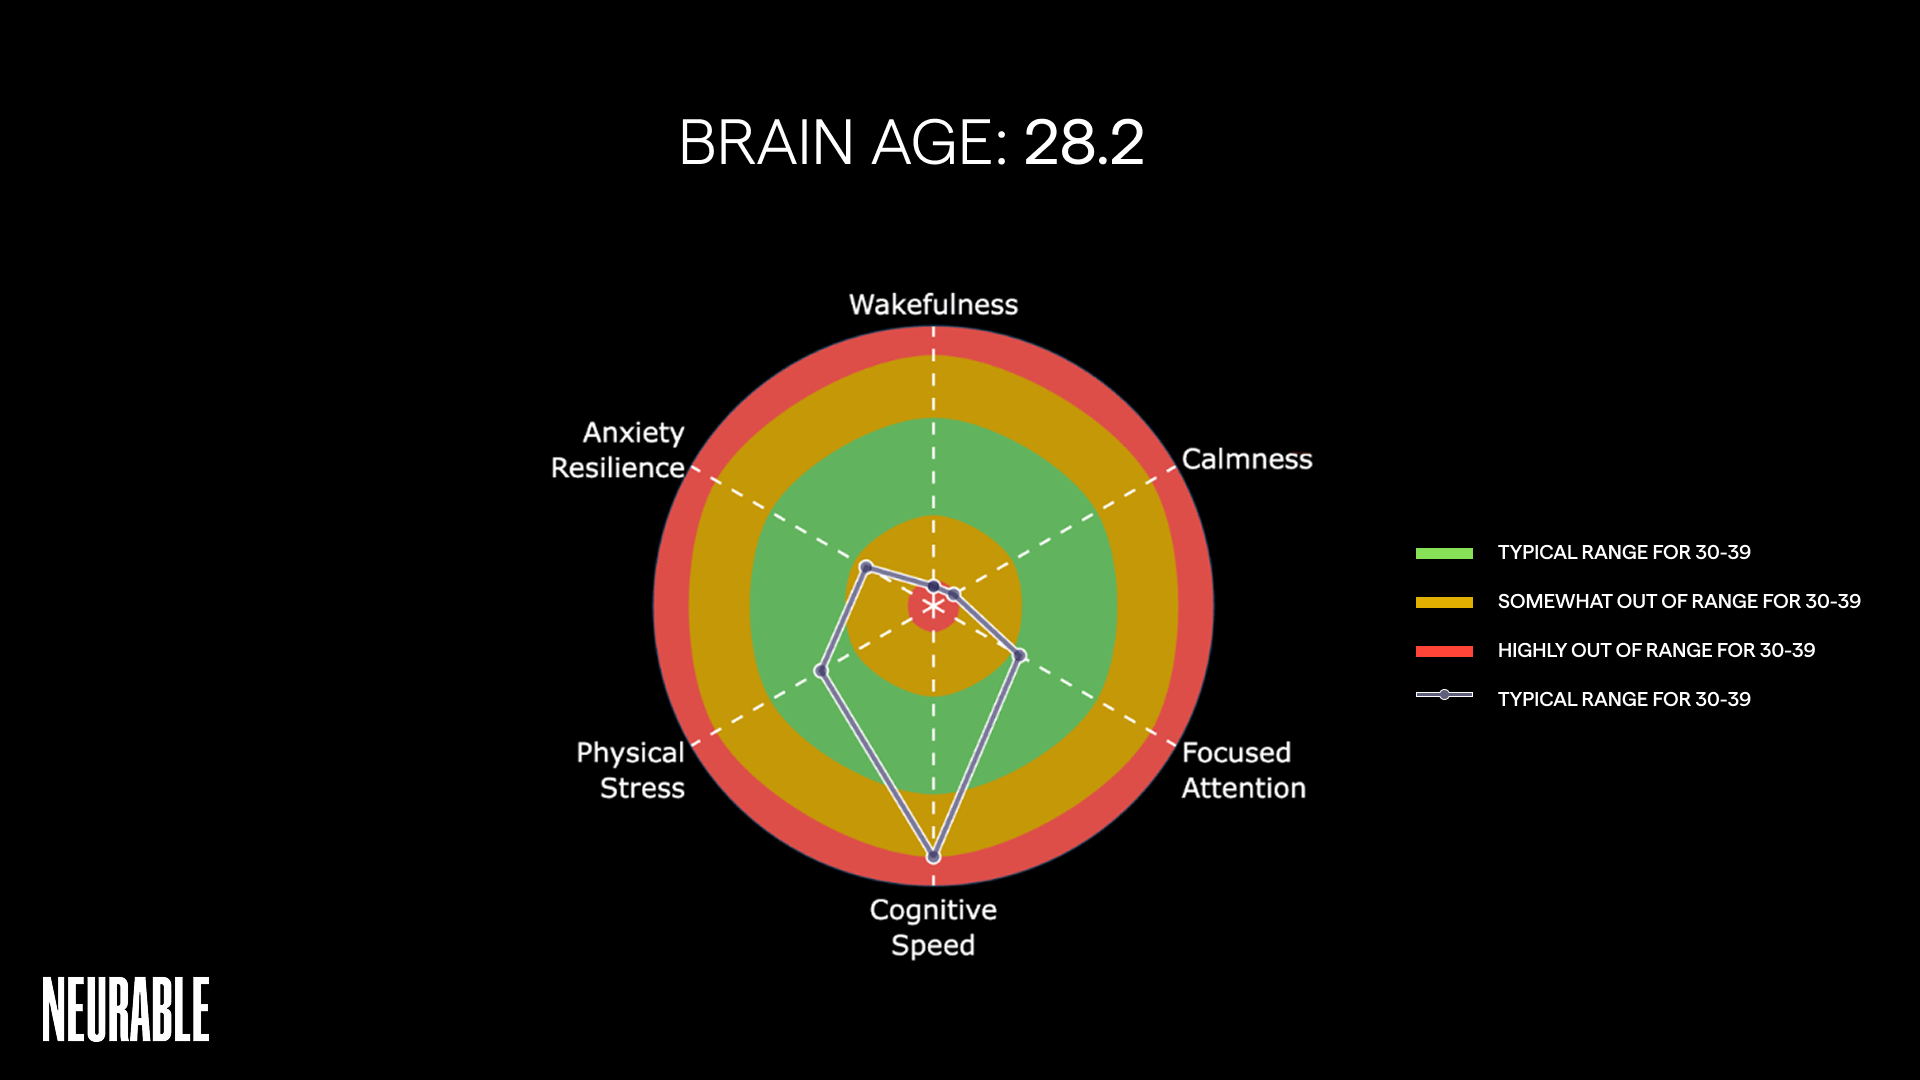
By April 5th, the morning I was set to board a red-eye to London, my brain age had settled back to 31.4. Essentially myself again.
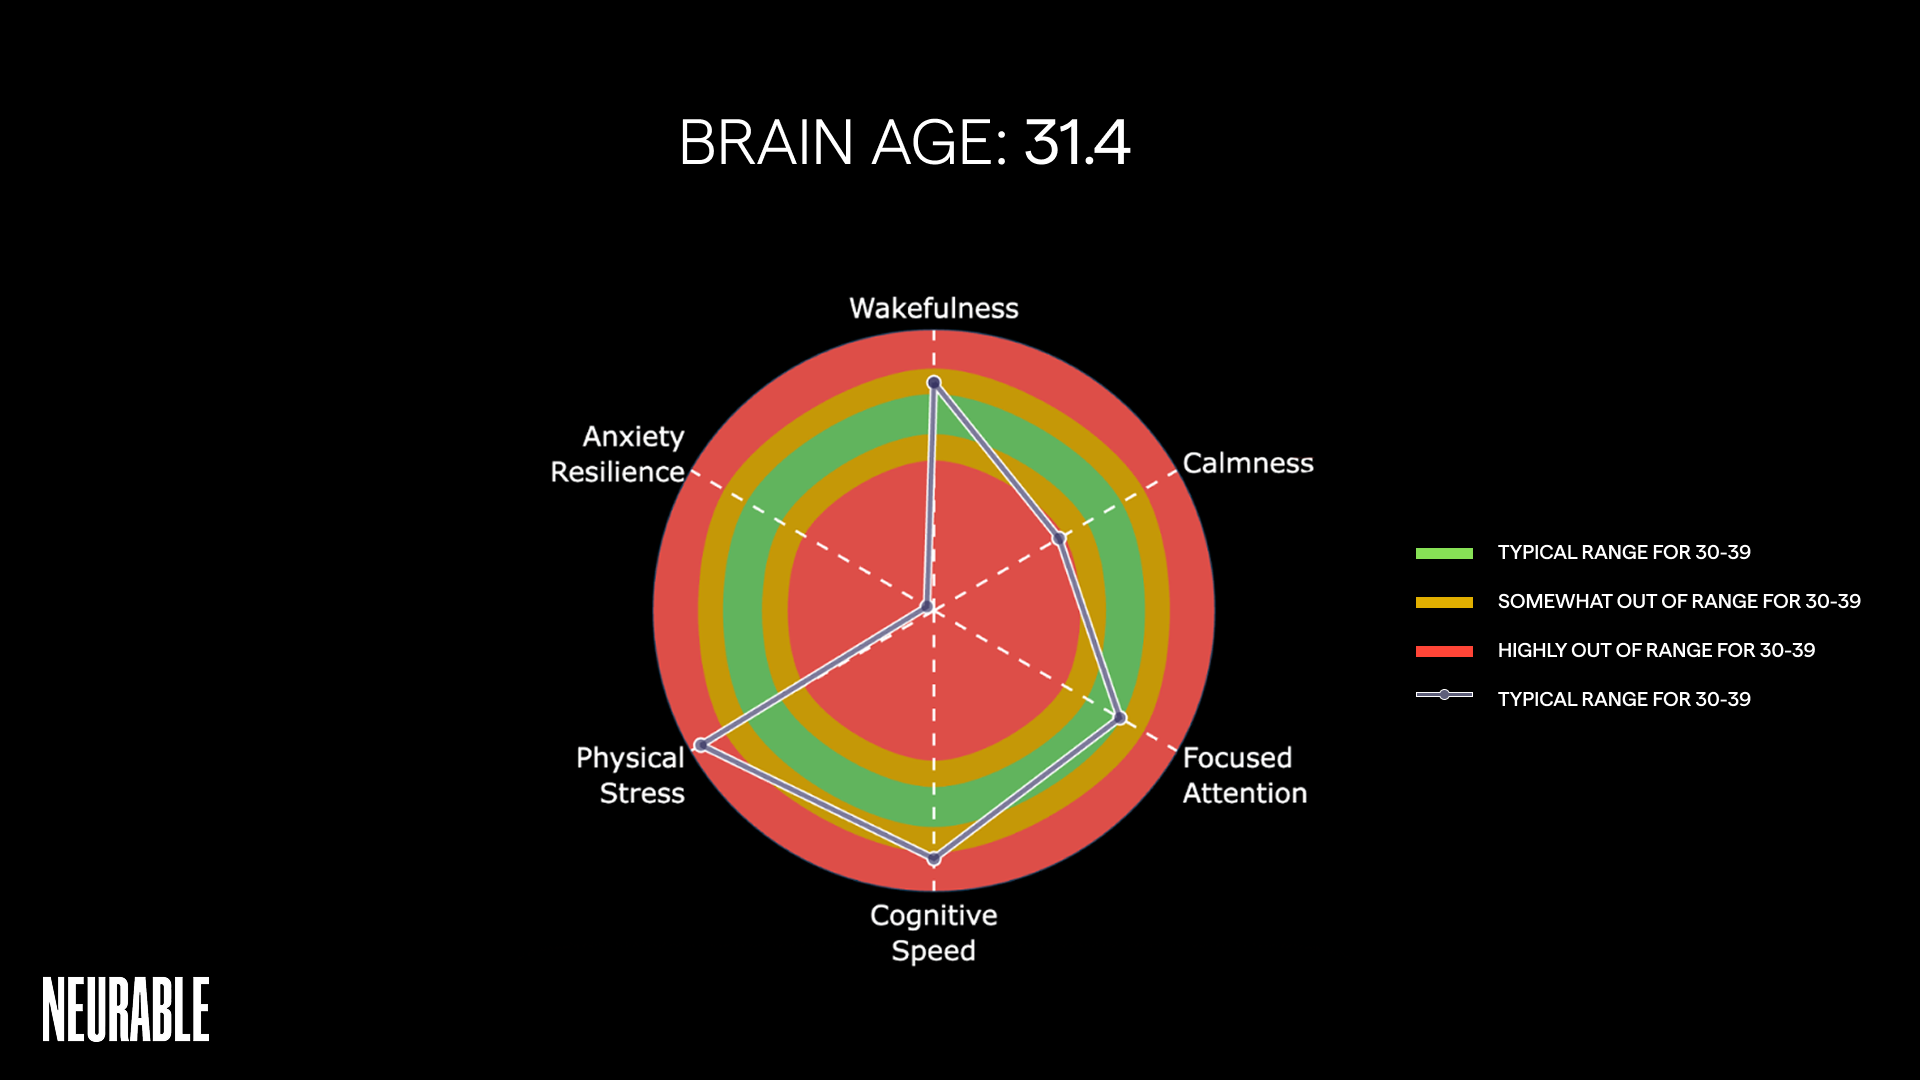
Then I got on the plane.
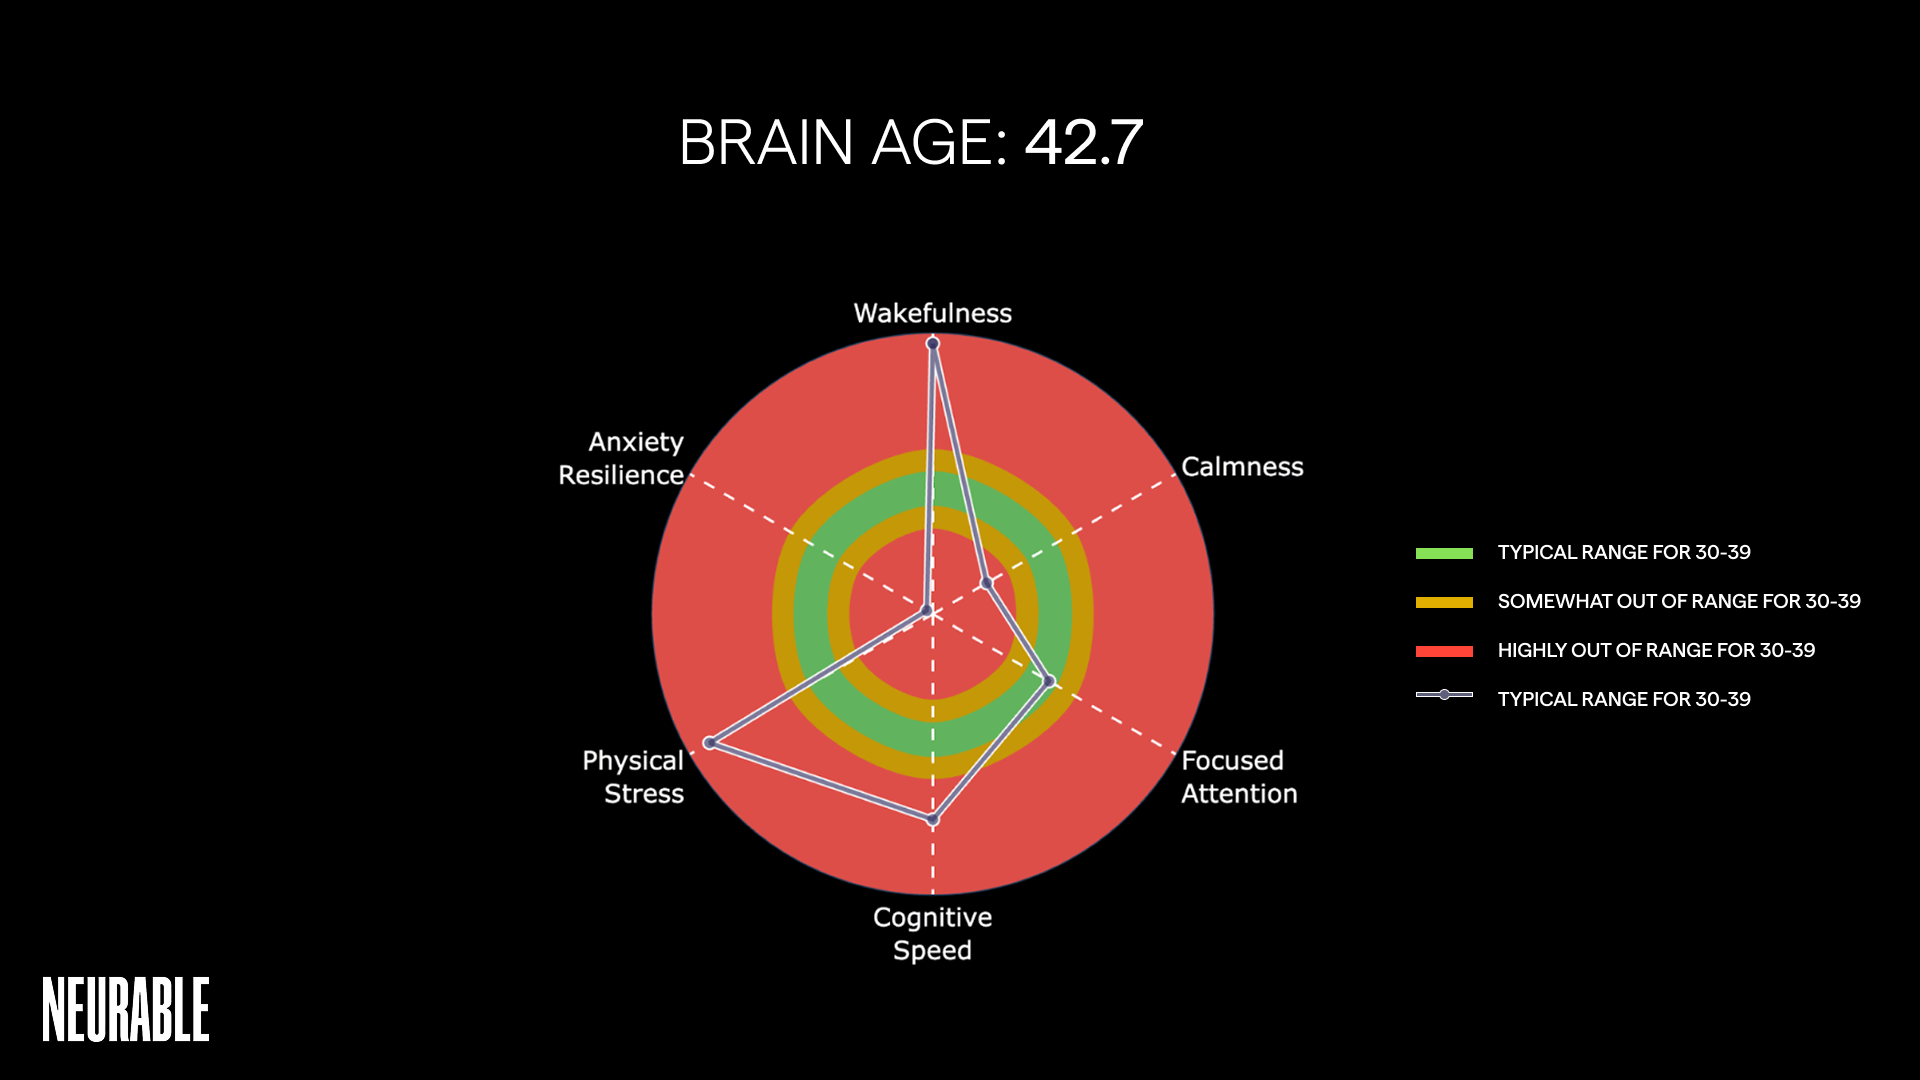
The reading I took in London the following afternoon — after a sleepless transatlantic flight, a five-hour time shift, and a full day of meetings — came back at 42.7. The jet lag had done to my brain age roughly what a moderate concussion had done five days earlier. I found that clarifying rather than alarming. The tool wasn’t measuring concussion specifically. It was measuring cognitive load, neurological stress, the aggregate demand of whatever your brain was managing right now. The concussion was the most dramatic version of that. The red-eye was a smaller, more familiar one. Both showed up. Neither could hide.
I am aware that I had an extraordinary advantage in this situation. I work in this field. I had the device, the research scientist on speed dial, the context to understand what I was looking at. Most people recovering from a concussion go home with instructions that amount to: rest, and wait to feel better. There is no consumer tool that tells them whether they’re actually recovering, or how their brain is responding to the demands they’re putting back on it.
I’ve written before about the gap in women’s cognitive health research — about how women’s brains are understudied, undersurveyed, and underserved by the tools we’ve built to measure them. Concussion is one more place that gap shows up. Female athletes sustain concussions at higher rates than male athletes in comparable sports, take longer to recover, and are more likely to have their symptoms minimized or attributed to anxiety. Objective neurological data doesn’t fix that systemic problem — but it changes the conversation. When you can show someone your brain age chart, you’re not describing a feeling. You’re showing them evidence.
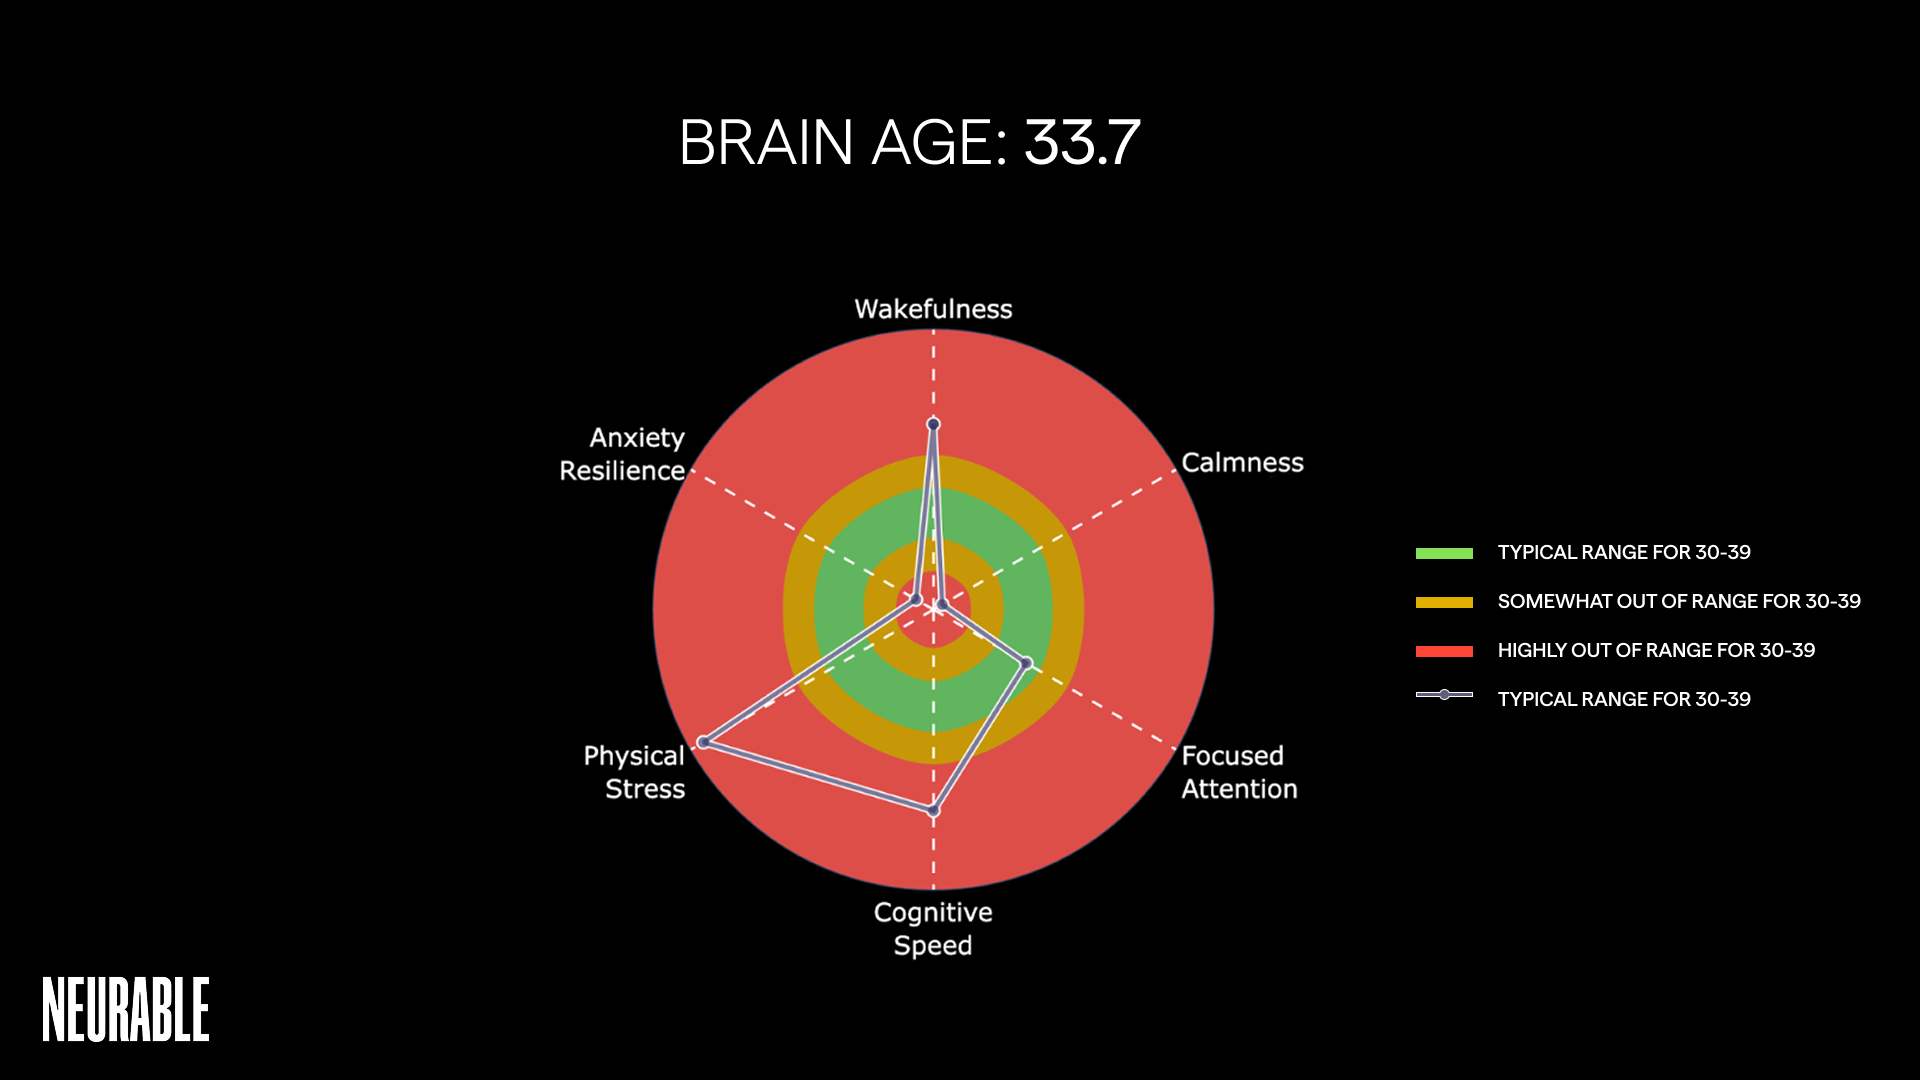
My brain age is 33.7 this morning. The London blur is clearing. The playground is not going anywhere.
For the first time in my life, I’ll actually know when I’m fully myself again — not because someone told me, but because I can see it.
2 Distraction Stroop Tasks experiment: The Stroop Effect (also known as cognitive interference) is a psychological phenomenon describing the difficulty people have naming a color when it's used to spell the name of a different color. During each trial of this experiment, we flashed the words “Red” or “Yellow” on a screen. Participants were asked to respond to the color of the words and ignore their meaning by pressing four keys on the keyboard –– “D”, “F”, “J”, and “K,” -- which were mapped to “Red,” “Green,” “Blue,” and “Yellow” colors, respectively. Trials in the Stroop task were categorized into congruent, when the text content matched the text color (e.g. Red), and incongruent, when the text content did not match the text color (e.g., Red). The incongruent case was counter-intuitive and more difficult. We expected to see lower accuracy, higher response times, and a drop in Alpha band power in incongruent trials. To mimic the chaotic distraction environment of in-person office life, we added an additional layer of complexity by floating the words on different visual backgrounds (a calm river, a roller coaster, a calm beach, and a busy marketplace). Both the behavioral and neural data we collected showed consistently different results in incongruent tasks, such as longer reaction times and lower Alpha waves, particularly when the words appeared on top of the marketplace background, the most distracting scene.
Interruption by Notification: It’s widely known that push notifications decrease focus level. In our three Interruption by Notification experiments, participants performed the Stroop Tasks, above, with and without push notifications, which consisted of a sound played at random time followed by a prompt to complete an activity. Our behavioral analysis and focus metrics showed that, on average, participants presented slower reaction times and were less accurate during blocks of time with distractions compared to those without them.


