

- Remove the current class from the content27_link item as Webflows native current state will automatically be applied.
- To add interactions which automatically expand and collapse sections in the table of contents select the content27_h-trigger element, add an element trigger and select Mouse click (tap)
- For the 1st click select the custom animation Content 27 table of contents [Expand] and for the 2nd click select the custom animation Content 27 table of contents [Collapse].
- In the Trigger Settings, deselect all checkboxes other than Desktop and above. This disables the interaction on tablet and below to prevent bugs when scrolling.
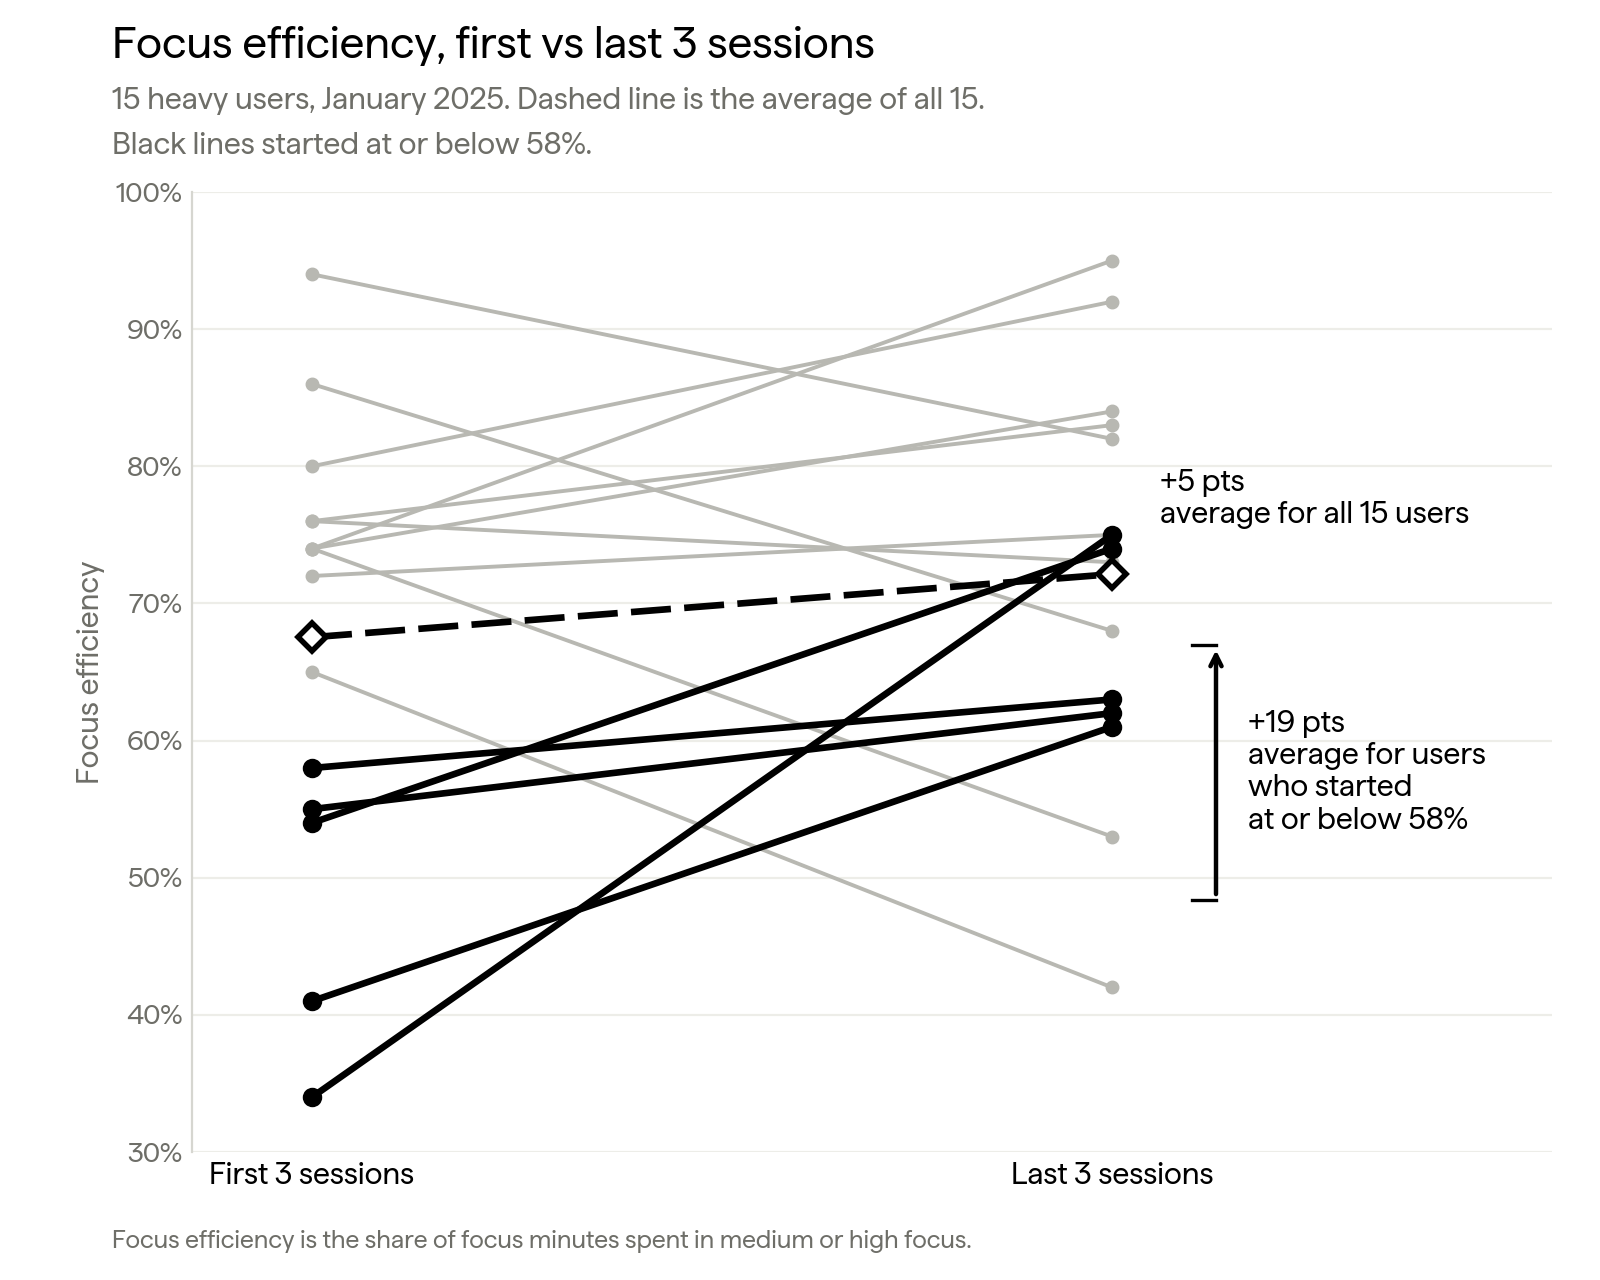
One of our users started the month at 34% focus efficiency. Thirty days later, they were at 75%. That one change got our attention (pun intended). People often ask us what happens to their focus numbers after a few weeks with the headphones so here’s a first look, highlighting what it shows, how we measured it, and why tracking our brains is an exciting frontier.
What we found
Two out of three people got better at holding their focus in a single month! We pulled a sample of Neurable users who wore the headphones at least 30 times in a month, 15 people in all, and 10 of them improved. The group average climbed from 67.5% to 72.1%. The people who started lowest saw the biggest jumps: anyone at or below 58% gained 19 points on average. Part of that is expected, since low first scores tend to rise on their own and early sessions are noisy while you get used to the fit. But we don’t think that’s the whole story, and we can’t wait to see what this looks like as the group grows.
How we measured it
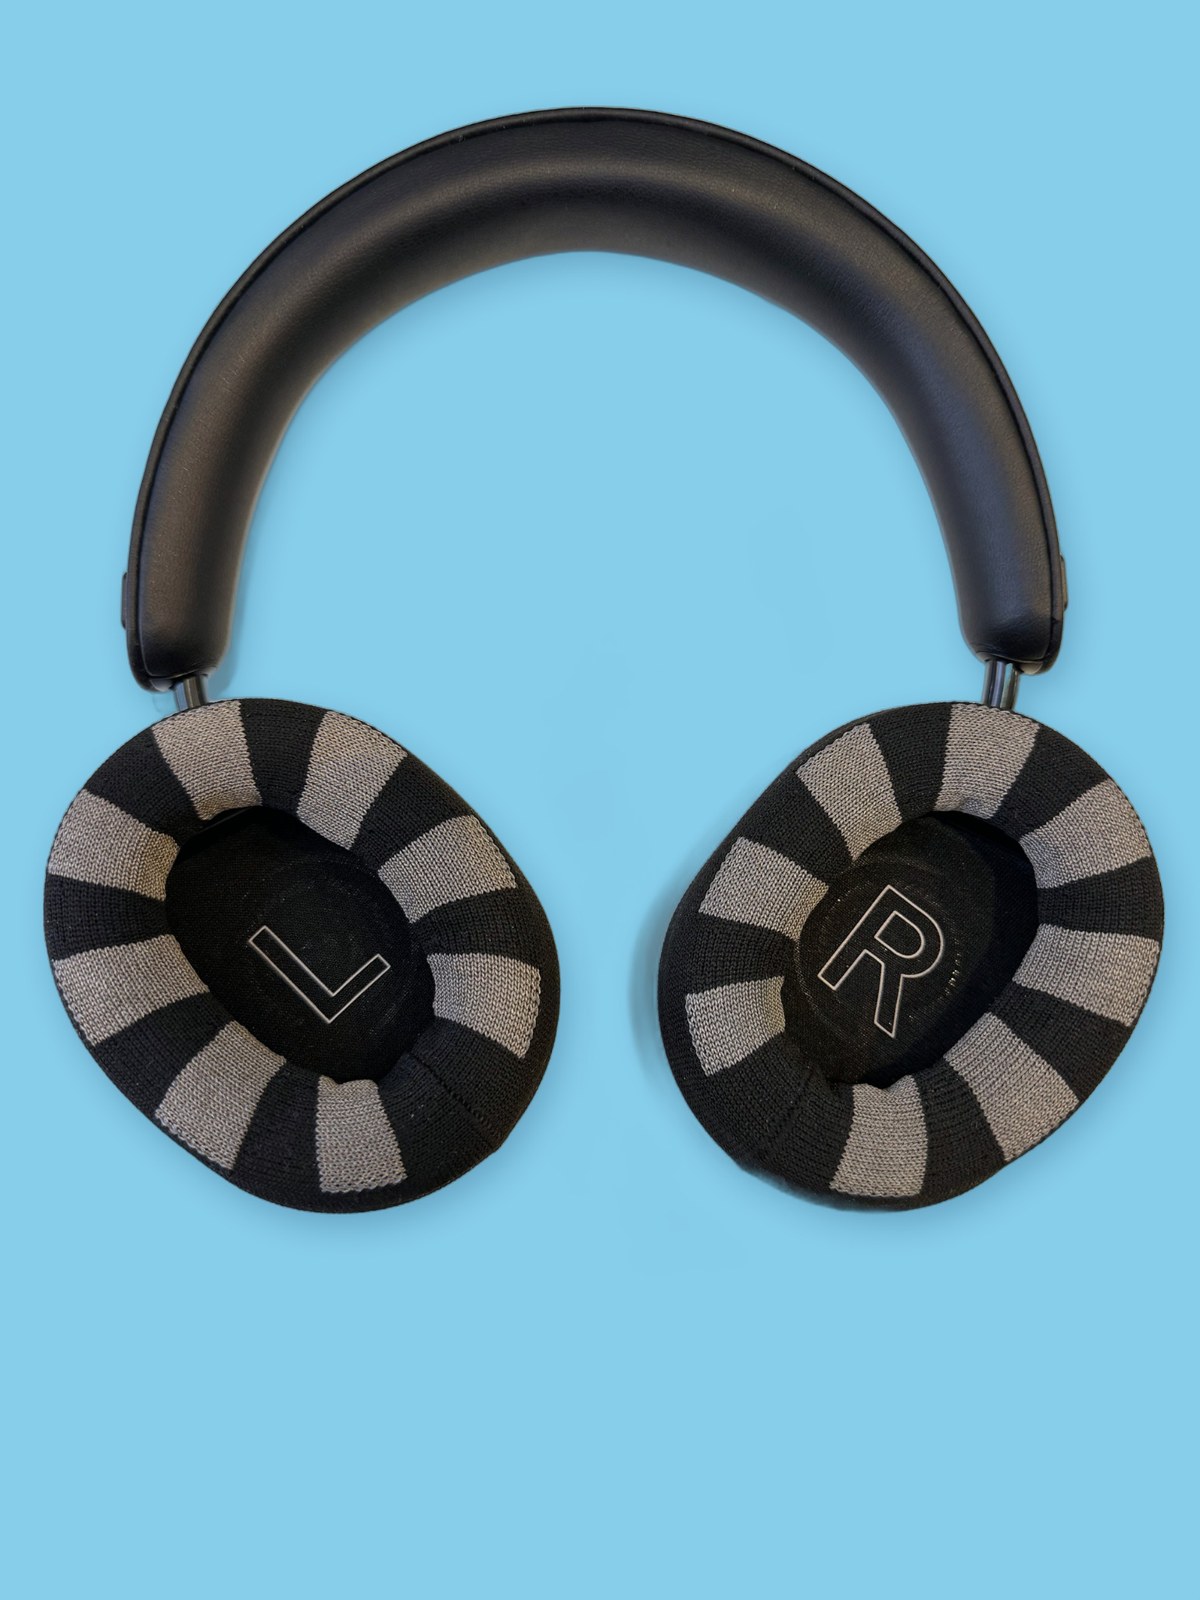
Here's the cool part: the headphones have EEG sensors built right into the ear pads (see below). They pick up the electrical activity your brain is already producing, and the app uses that signal to sort every minute of a focus session into low, medium or high focus.
For each person, we averaged their first 3 sessions and their last 3, then compared the two. Focus efficiency is the share of focus time spent in medium or high focus.
What we're still figuring out
Fifteen people is a small group, but the pattern was clear enough to share observationally. Note, everyone here used the headphones a lot, and people who dropped off early might look different. We didn't have a comparison group, so we can't say yet what would have happened without the headphones. The headphones were also the only thing measuring focus. And not everyone improved: for 5 of the 15, focus efficiency stayed flat or dipped, which makes sense especially for those already started with high-focus.
Why this is exciting
Neurable headphones show you your own patterns: when your focus holds, when it drops, and how that shifts over weeks and months. This post is the same kind of view, just across a group of people.
This is one number over one month, and it's already telling us a lot. As more people use the headphones, we'll see how focus shifts across a day and what the people who improve most are doing differently. Right now, most of us guess at when we do our best thinking. That's about to change. You'll be able to see it, plan your day around it, and know whether a change you made worked. We think there's a huge amount of human potential sitting unused simply because people can't see how their own brain works. Giving people that view is what we're here to do!
We'll keep sharing what we find as the group grows, limits and all. Stay tuned!
Everything in this post comes from de-identified focus data, looked at as a group. Names, emails and account details were removed before we analyzed anything, and no one can be identified from the numbers or the chart. Even our 34% to 75% user is just one anonymous line. If you have questions, reach us at info@neurable.com.
2 Distraction Stroop Tasks experiment: The Stroop Effect (also known as cognitive interference) is a psychological phenomenon describing the difficulty people have naming a color when it's used to spell the name of a different color. During each trial of this experiment, we flashed the words “Red” or “Yellow” on a screen. Participants were asked to respond to the color of the words and ignore their meaning by pressing four keys on the keyboard –– “D”, “F”, “J”, and “K,” -- which were mapped to “Red,” “Green,” “Blue,” and “Yellow” colors, respectively. Trials in the Stroop task were categorized into congruent, when the text content matched the text color (e.g. Red), and incongruent, when the text content did not match the text color (e.g., Red). The incongruent case was counter-intuitive and more difficult. We expected to see lower accuracy, higher response times, and a drop in Alpha band power in incongruent trials. To mimic the chaotic distraction environment of in-person office life, we added an additional layer of complexity by floating the words on different visual backgrounds (a calm river, a roller coaster, a calm beach, and a busy marketplace). Both the behavioral and neural data we collected showed consistently different results in incongruent tasks, such as longer reaction times and lower Alpha waves, particularly when the words appeared on top of the marketplace background, the most distracting scene.
Interruption by Notification: It’s widely known that push notifications decrease focus level. In our three Interruption by Notification experiments, participants performed the Stroop Tasks, above, with and without push notifications, which consisted of a sound played at random time followed by a prompt to complete an activity. Our behavioral analysis and focus metrics showed that, on average, participants presented slower reaction times and were less accurate during blocks of time with distractions compared to those without them.


